Bling dashboards using Graphite and Dashing
19 Nov 2012At Marlon we have some projects that are using StatsD for application logging and monitoring. Graphite is used as the backend, giving us the ability to quickly create real-time graphs for important events in our applications. If you’re interested in how to setup and use those two technologies, then have a look at the excellent introduction by my colleague Dieter Provoost.
This post however is about how you can use the monitoring data that’s stored inside the Graphite backend to quickly create a beautiful dashboard using Dashing.
What’s Dashing?
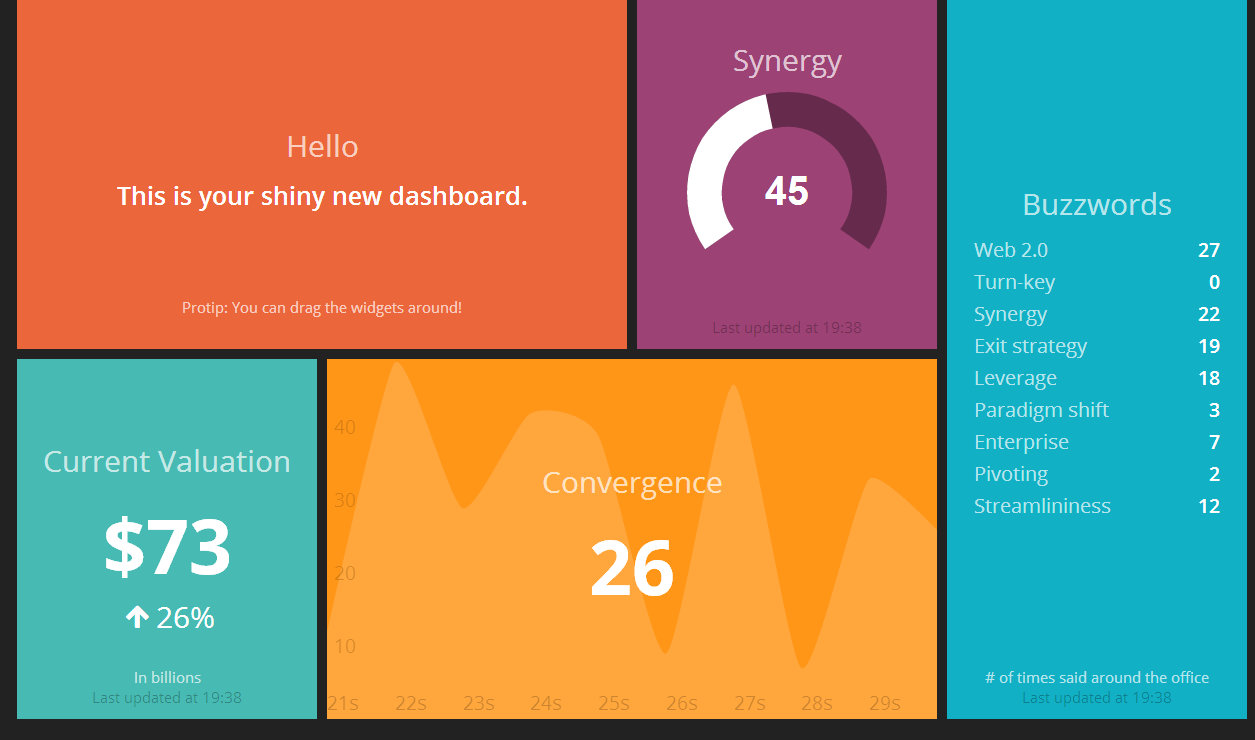
Dashing is dashboard framework, created by the people at Shopify. It’s intended to create beautiful dashboards quicly and easily. If you take a look at the example application, you’ll immediately see what they mean. The dashboard is lively and looks a lot better than the default graphite graphs.
Check this page for installing dashing on your system and creating a new dashboard project. Now that you have dashboard project we can start modifying it in order to access your graphite backend.
Querying graphite
Graphite comes with a basic user interface, but what’s more important for our scenario is that you can also access all data
using an easy API. Let’s say you want all data for a given key stats.key.for.production.count from the last hour. All
that’s needed is an HTTP request to the following URL:
http://url.to.your.graphite.intance.com/render?format=json&target=stats.key.for.production.count&from=-60min
This will return a JSON reponse that looks - depending on your own data - something like this:
[
    {
        "target": "stats.key.for.production.count",
        "datapoints": [
            [14.0, 1352887680 ],
            [17.0, 1352887710 ],
            [20.0, 1352887740 ],
             ...
            [24.0, 1352891220 ],
            [16.0, 1352891250 ]
        ]
    }
]
The datapoints contain the actual data: the first element of the array is the value, the second value is the time expressed in ticks. Pretty straightforward.
Querying graphite using Ruby
So we now know how to query Graphite using the JSON API, let’s create an easy class that allows us to:
- fetch a list of recent points that can be used to send to the Dashing graph widget.
- fetch the last value for a given key, so that we can use it to power the gauge-like Dashing widgets. These don’t need a series of data, only the last value is important.
We’ll be using the RestClient gem to make calling the REST api easy. Save the file in the lib folder of your dashboard
application. See inline comments for some more information
require "rest-client"
require "JSON"
require "date"

class Graphite
    # Pass in the url to where you graphite instance is hosted
    def initialize(url)
        @url = url
    end

    def get_value(datapoint)
        value = datapoint[0] || 0
        return value.round(2)
    end

    # This is the raw query method, it will fetch the
    # JSON from the Graphite and parse it
    def query(name, since=nil)
        since ||= '-2min'
        url = "#{@url}/render?format=json&target=#{name}&from=#{since}"
        response = RestClient.get url
        result = JSON.parse(response.body, :symbolize_names => true)
        return result.first
    end

    # This is high-level function that will fetch a set of datapoints
    # since the given start point and convert it into a format that the
    # graph widget of Dashing can understand
    def points(name, since=nil)
        stats = query name, since
        datapoints = stats[:datapoints]

        points = []
        count = 1

        (datapoints.select { |el| not el[0].nil? }).each do|item|
            points << { x: count, y: get_value(item)}
            count += 1
        end

        return points
    end

    # Not all Dashing widgets need a set of points, often just
    # the current value is enough. This method does just that, it fetches
    # the value for last point-in-time and returns it
    def value(name, since=nil)
        stats = query name, since
        last = (stats[:datapoints].select { |el| not el[0].nil? }).last

        return get_value(last)
    end
end
Creating a job to send data to the dashboard
This simple utility class now allows us to query our Graphite backend, the next step is to create a background job that will periodically query the backend and sends the data over to the dashboard.
In Dashing this is done using rufus_scheduler jobs.
Simply add a file called graphite.rb to the jobs folder of your Dashing project. In there, define the jobs
you want a bit like in the example below.
require "./lib/graphite"

# last started parkingsessions
SCHEDULER.every '30s', :first_in => 0 do
    # Create an instance of our helper class
    q = Graphite.new "http://url.to.your.graphite.intance.com/"

    incomingsms_target = "stats_counts.production.sms.incoming"

    # get the current value
    current = q.value incomingsms_target, "-1min"
    # get points for the last half hour
    points = q.points incomingsms_target, "-30min"

    # send to dashboard, so the number the meter and the graph widget can understand it
    send_event 'incoming_sms', { current: current, value: current, points: points }
end
One of our applications processes incoming SMS messages, and we want to visualize this in our Dashing dashboard. They are flushed to the Graphite backend every 30 seconds, so that’s our interval for the Dashing job as well. Additionally we send the data to the dashboard in a format that can be interpreted by the number (current), the meter(value) and the graph (points) widget.
Other widgets might need the data in yet another format, but their coffeescript code is easy enough to understand. So adding support for those is pretty straightforward.
Making the widgets accept the data
This is our final step: we need to make sure that the widgets on the dashboard intercept the data that is sent out by the job
we just created. The key that is used to identify the data is incoming_sms, so that’s what we need to assign to the data-id
property. Once that is done, the Dashing will receive the data that’s coming from the background job and direct it to the correct
widget. Open up the erb file in the dashboards folder and modify one of the widget to accept the data we are sending out.
<li data-row="1" data-col="1" data-sizex="1" data-sizey="1">
   <div data-id="incoming_sms" data-view="Number" data-title="Incoming" data-moreinfo="In last 30s"></div>
</li>
Round up
You have now seen that it’s pretty straight forward to make Dashing query your Graphite backend. While the Graphite backend is functional, Dashing allows you to make things a lot prettier.